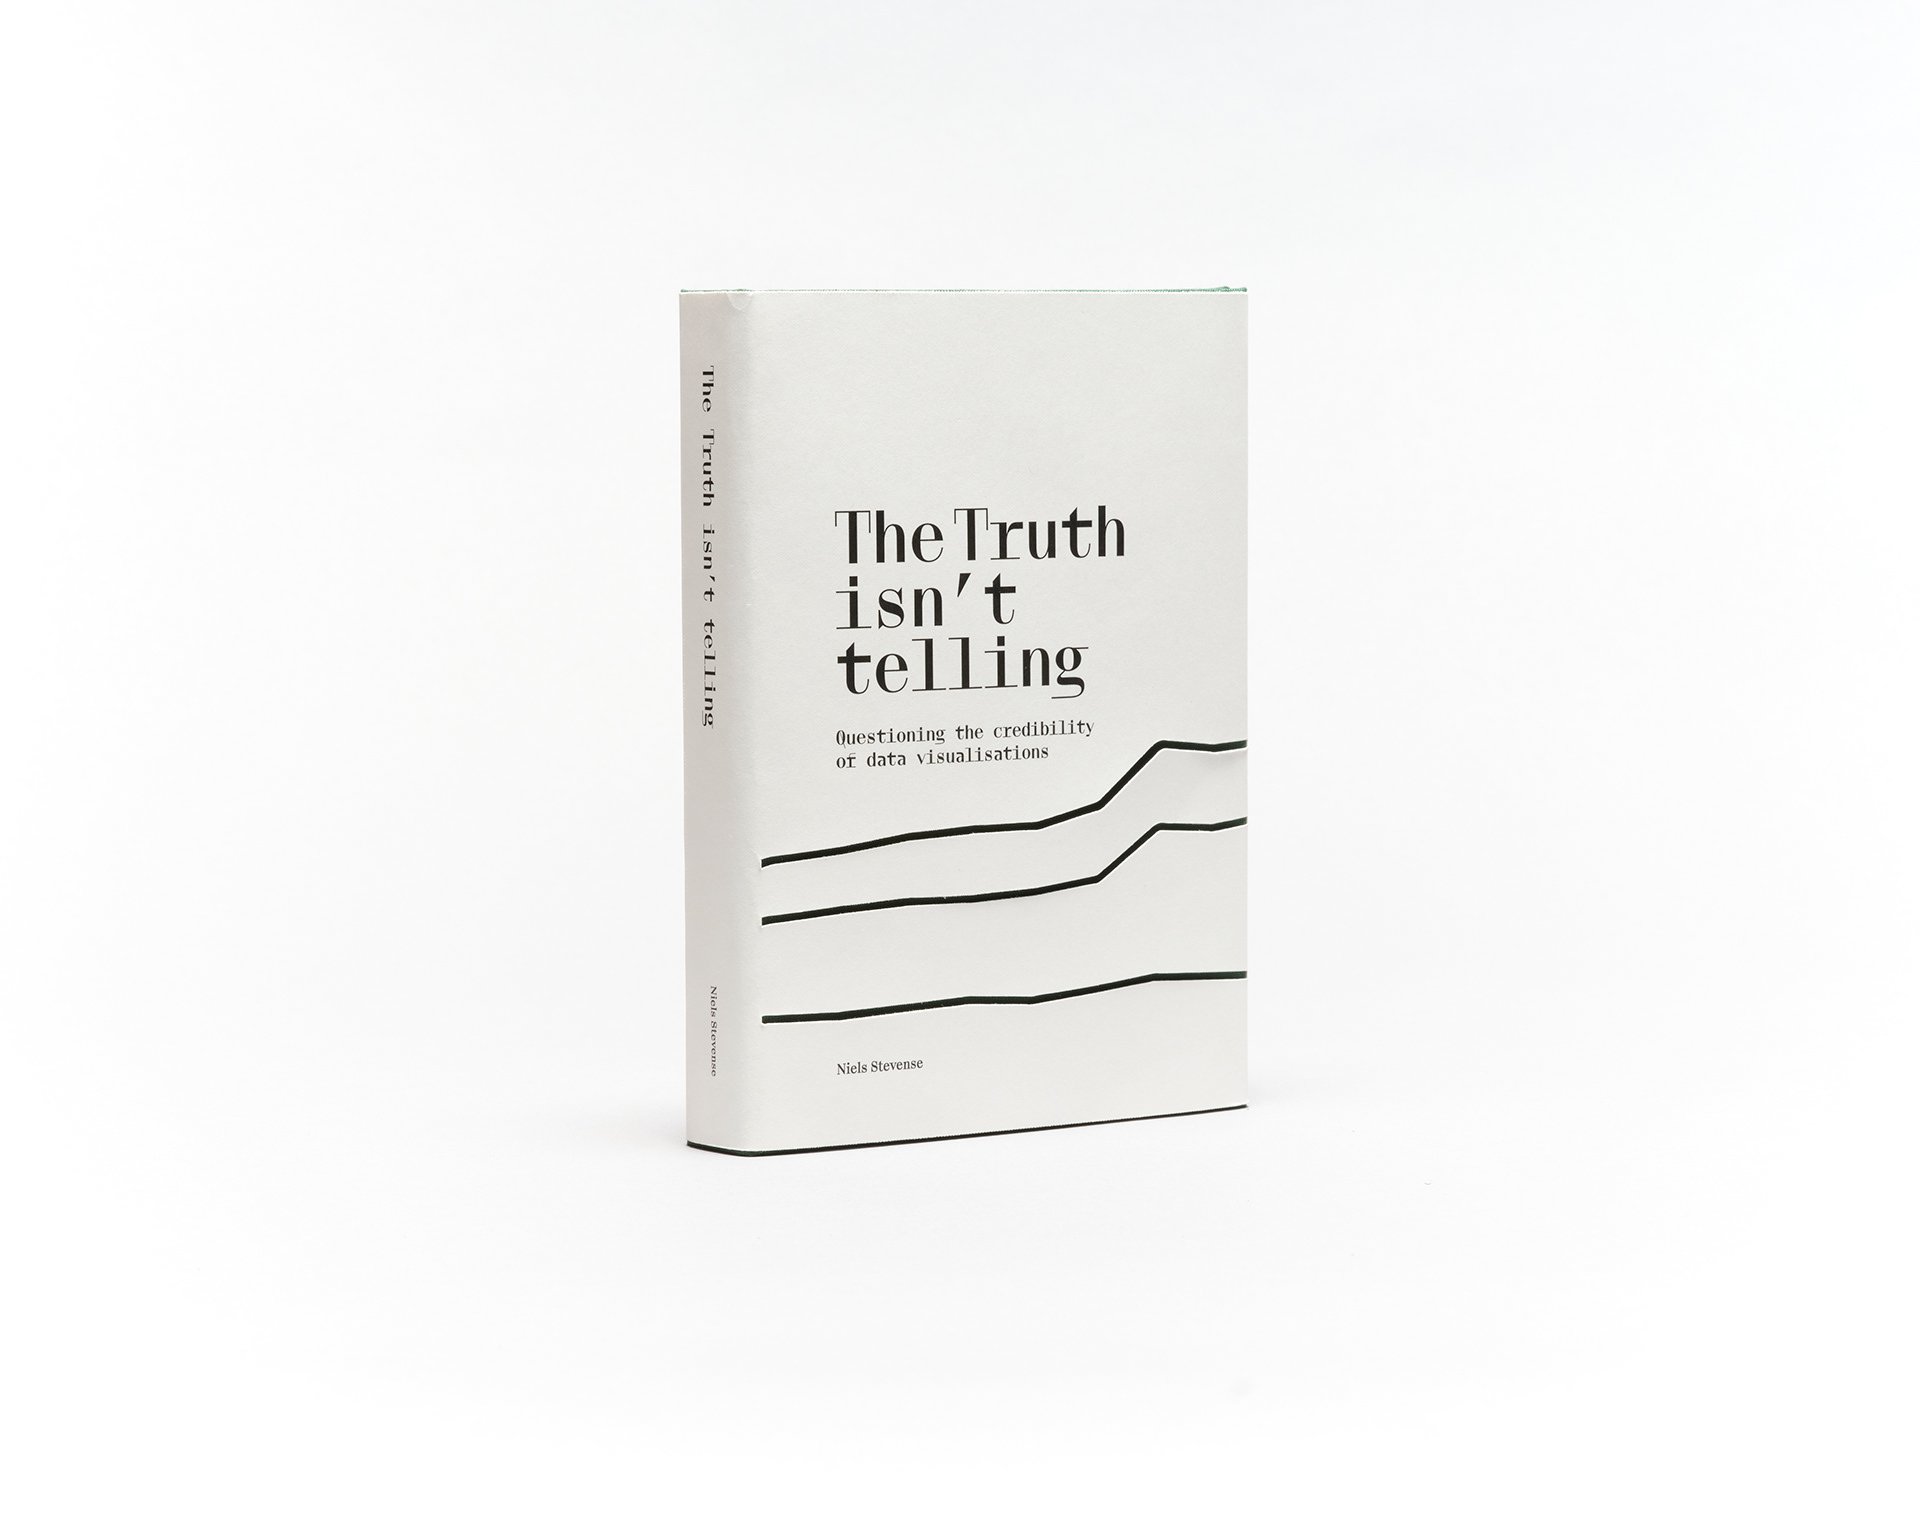
The Truth
isn't telling
“Data visualisation is almost a magic power; many people assume it is the only truth”
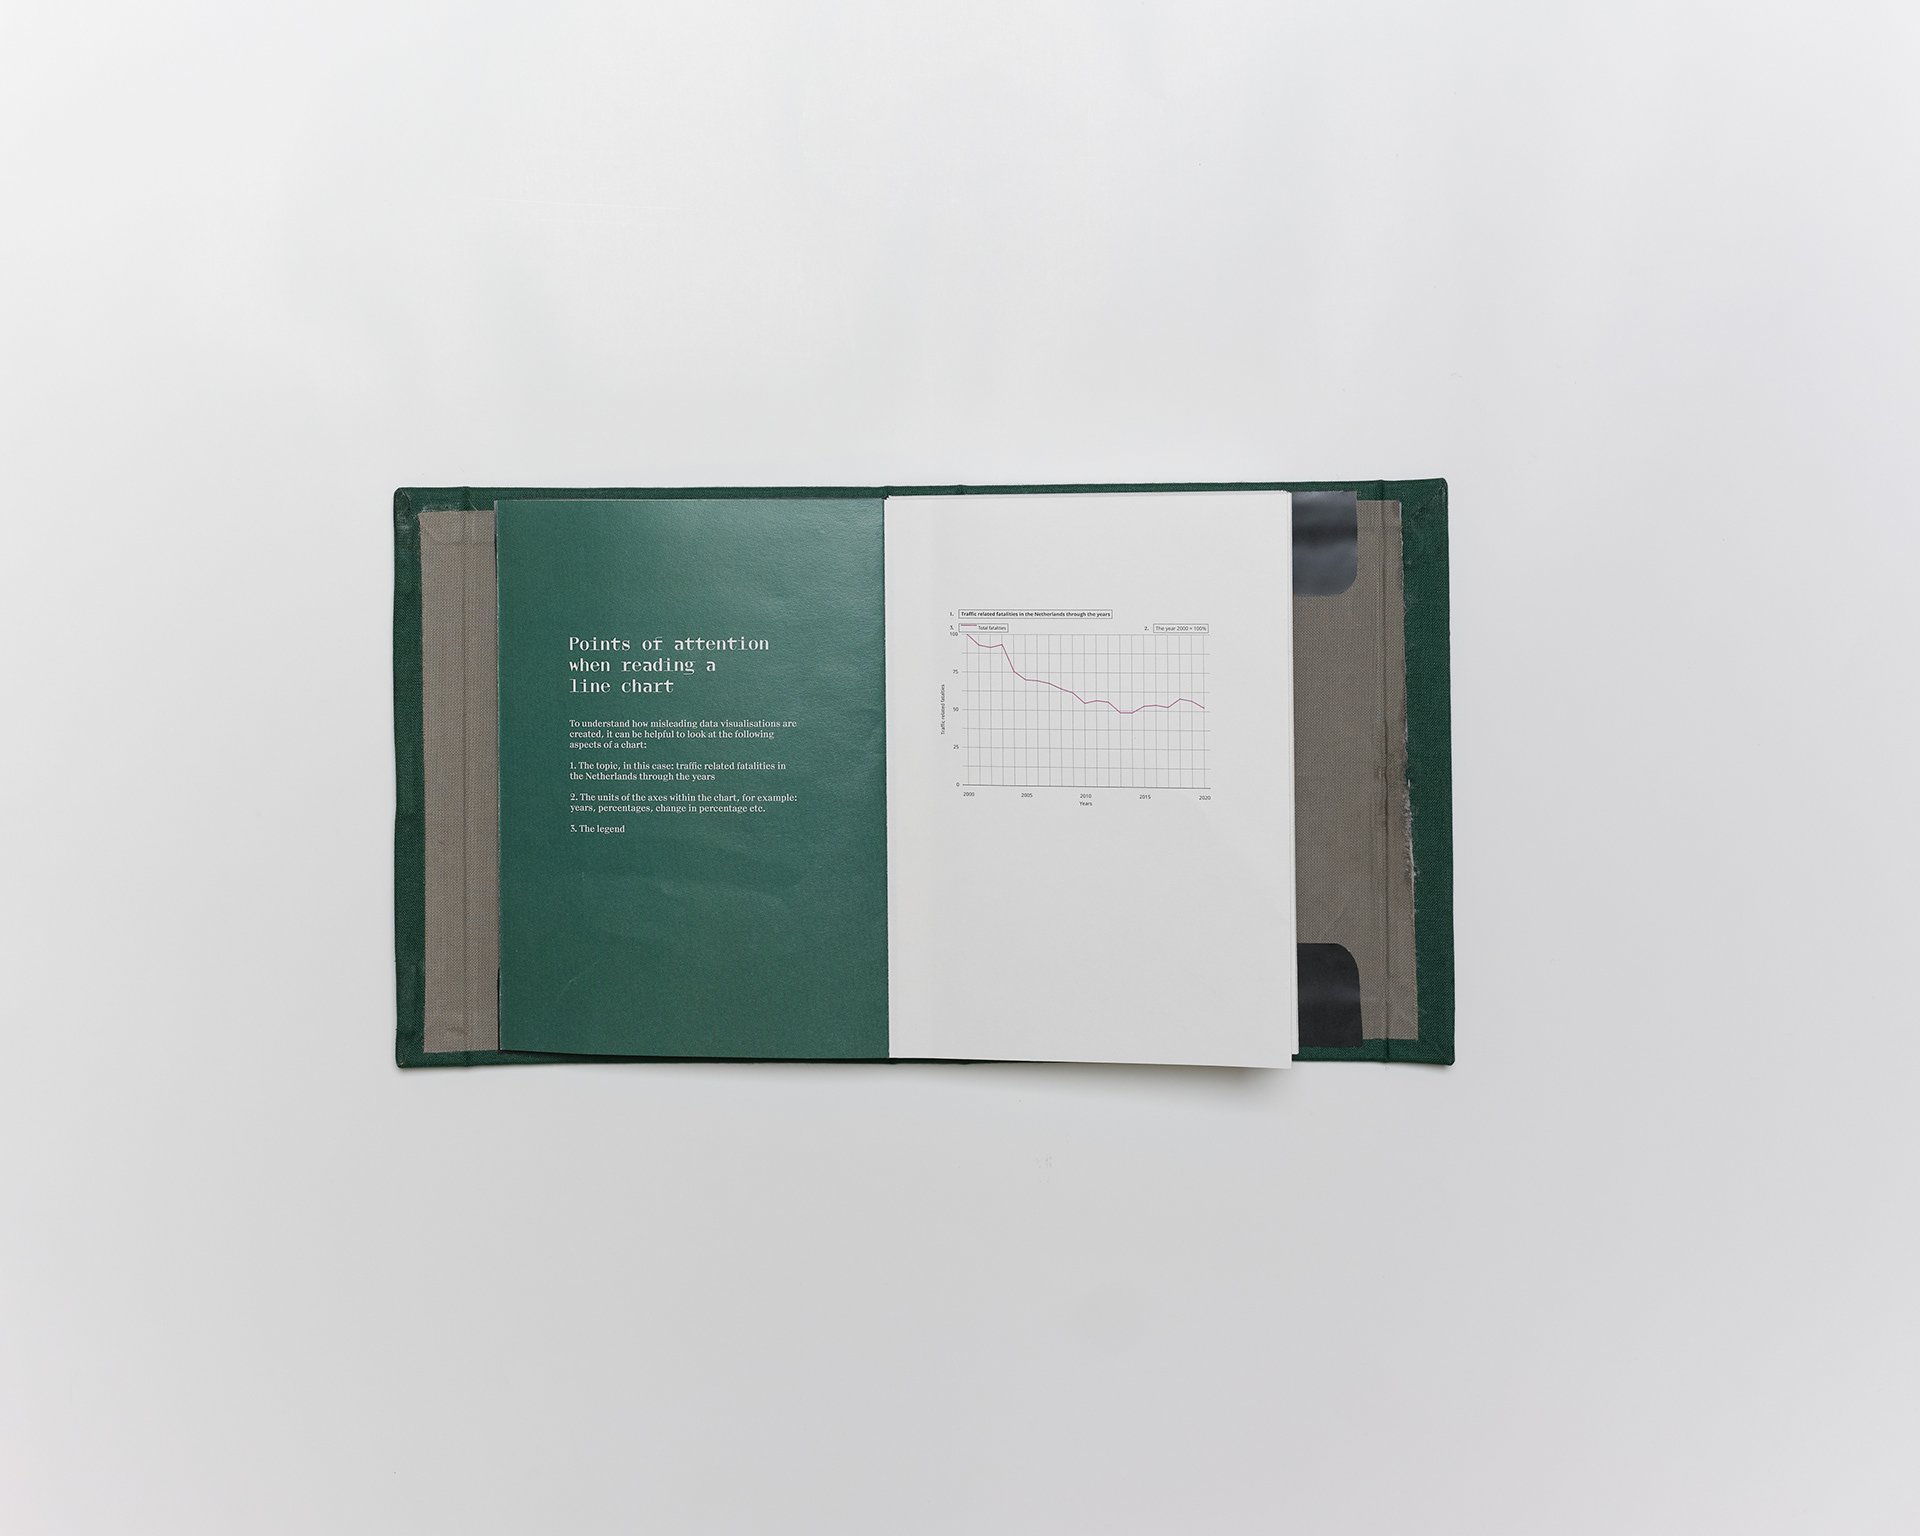
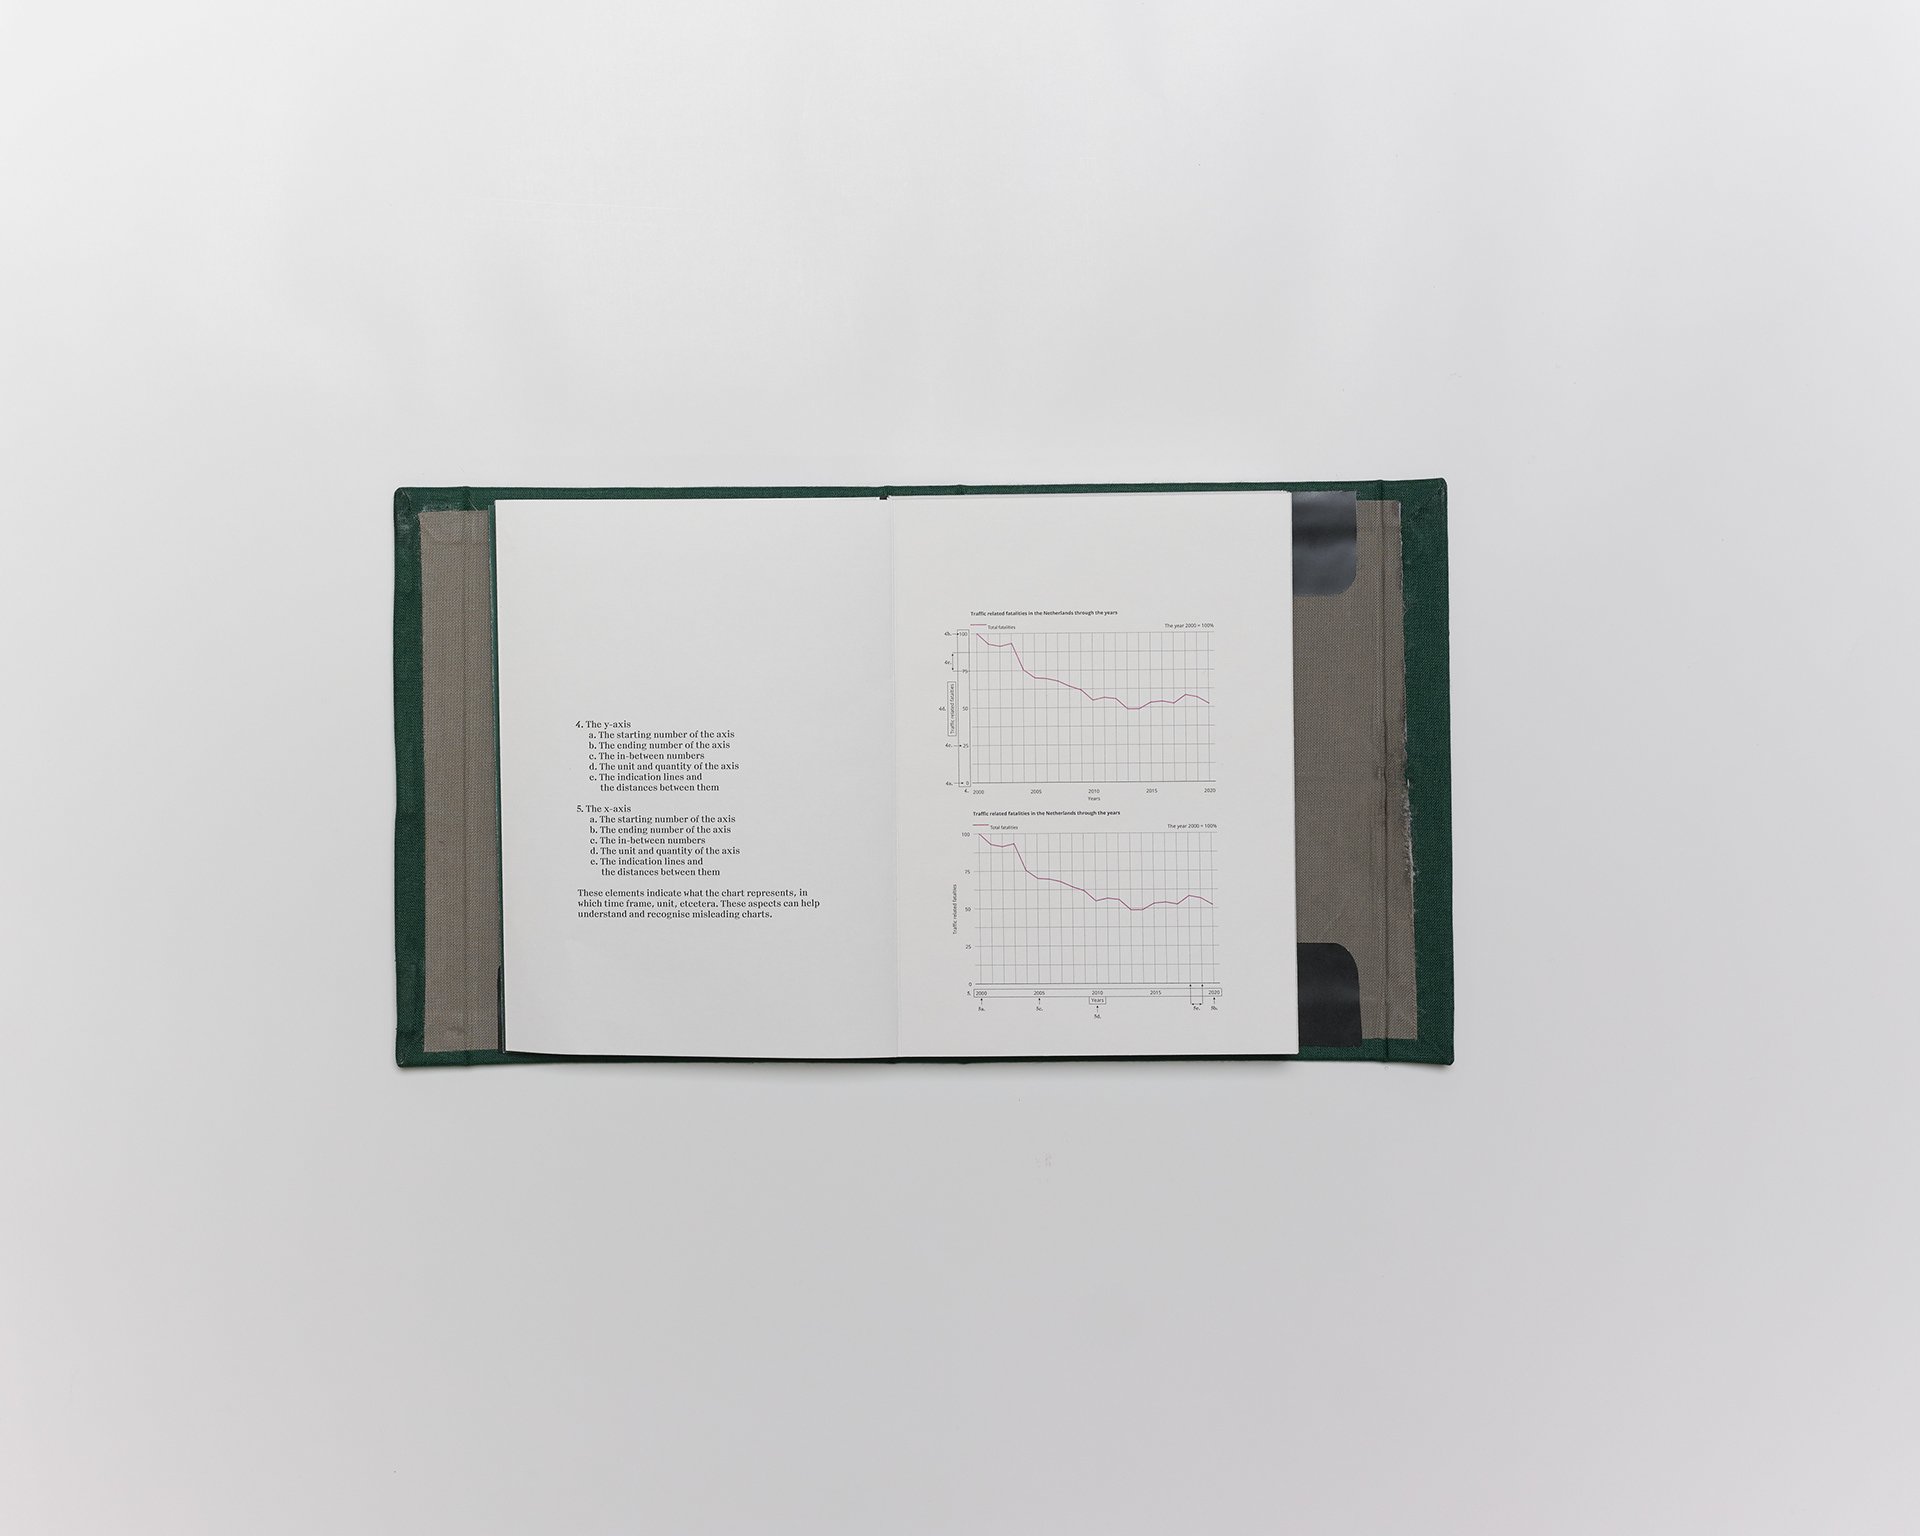
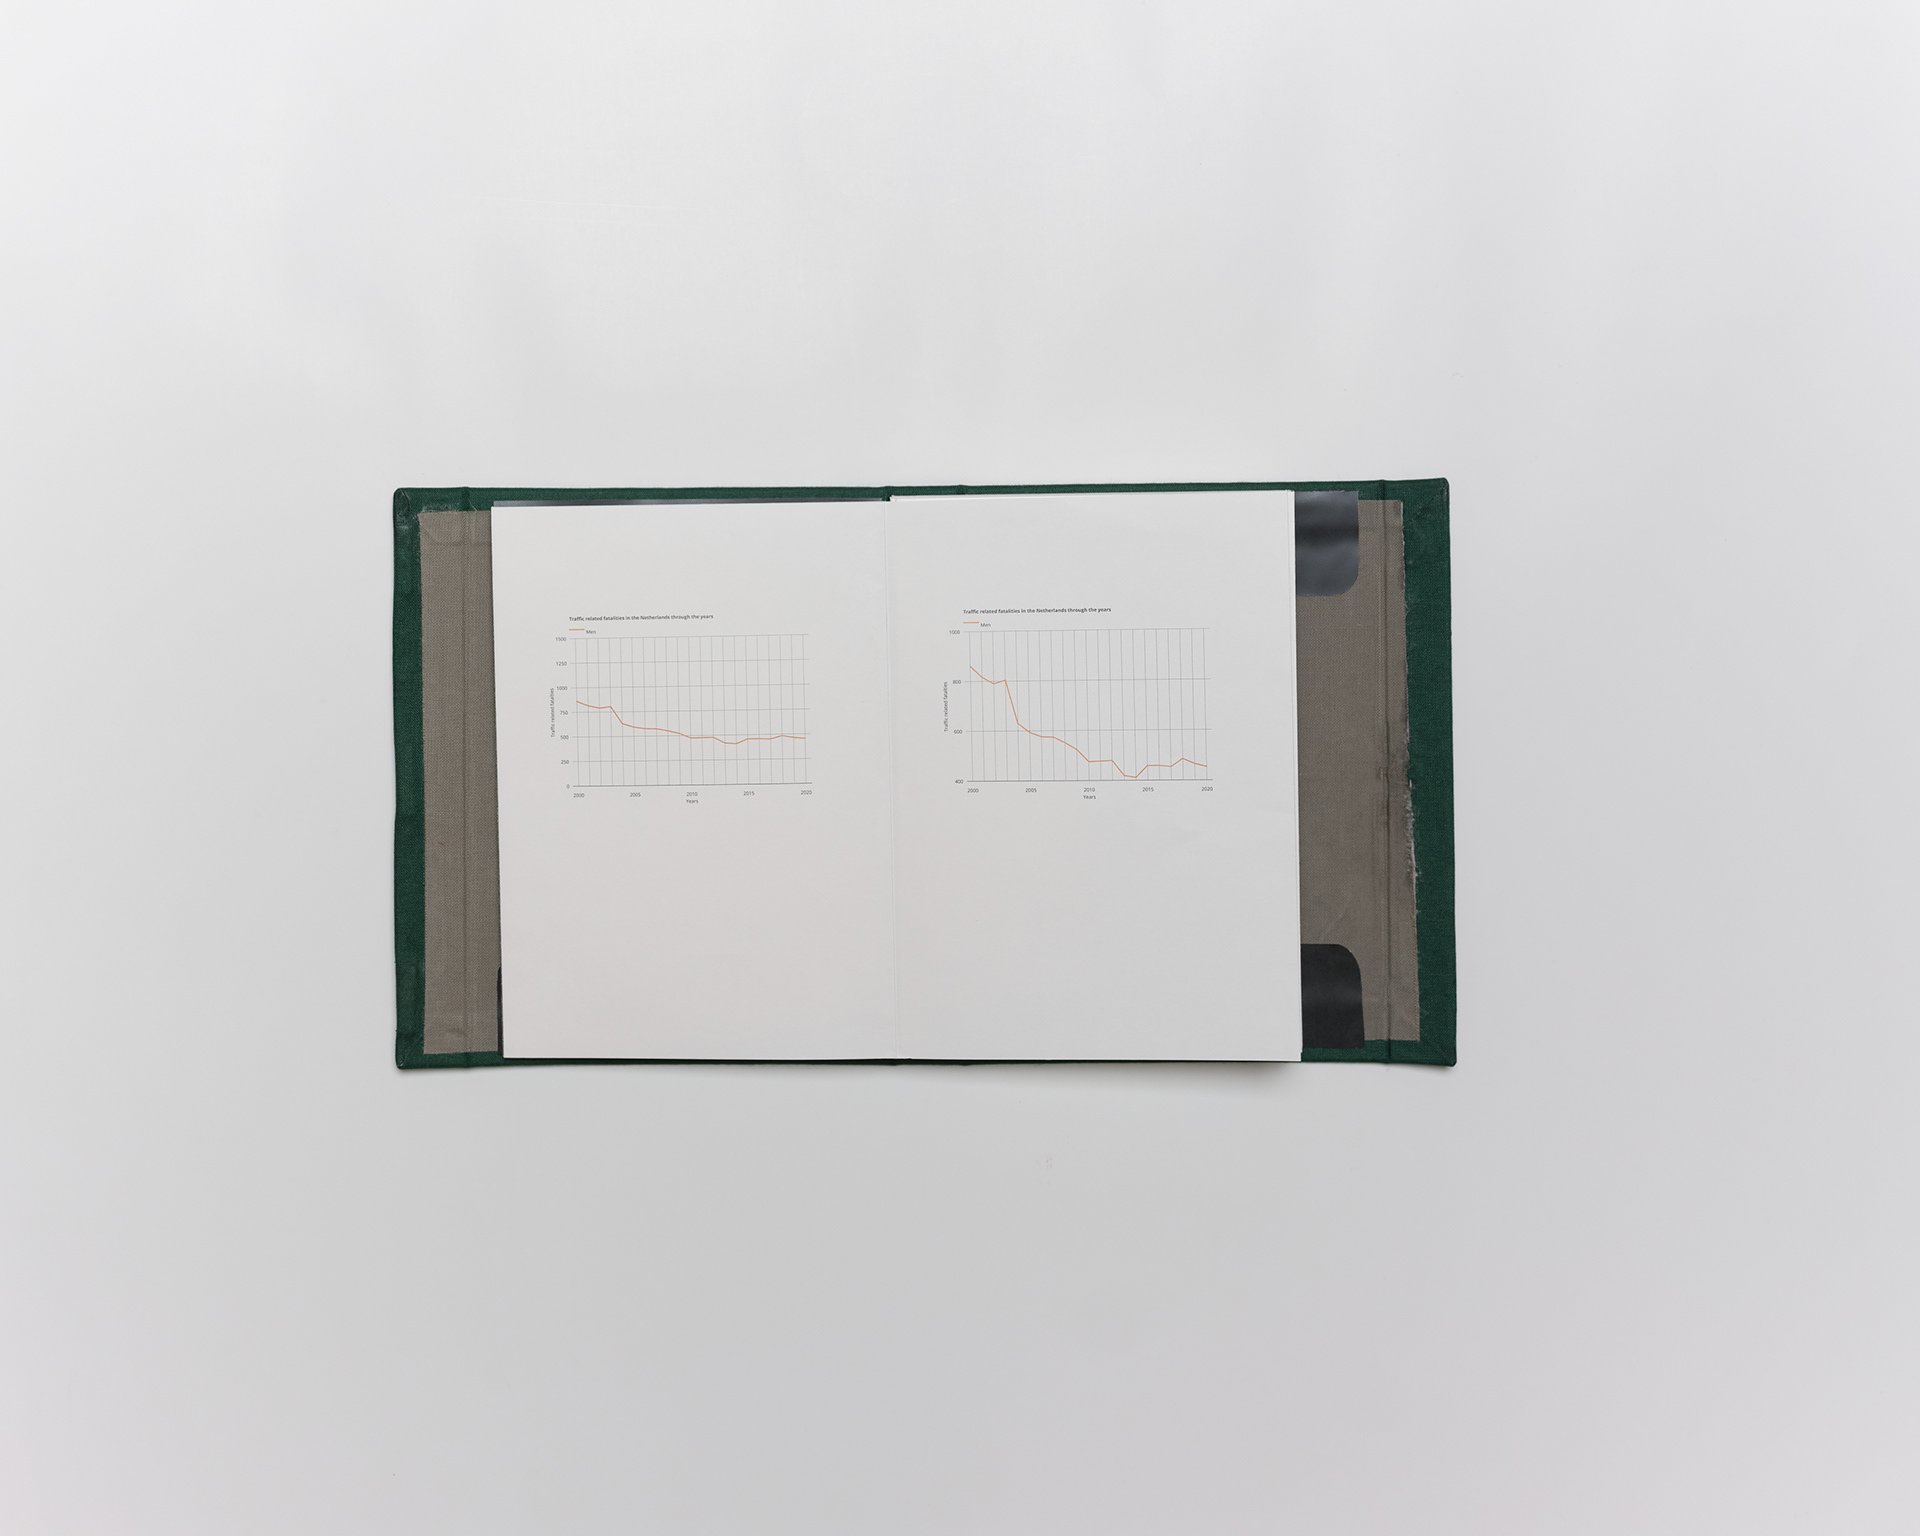
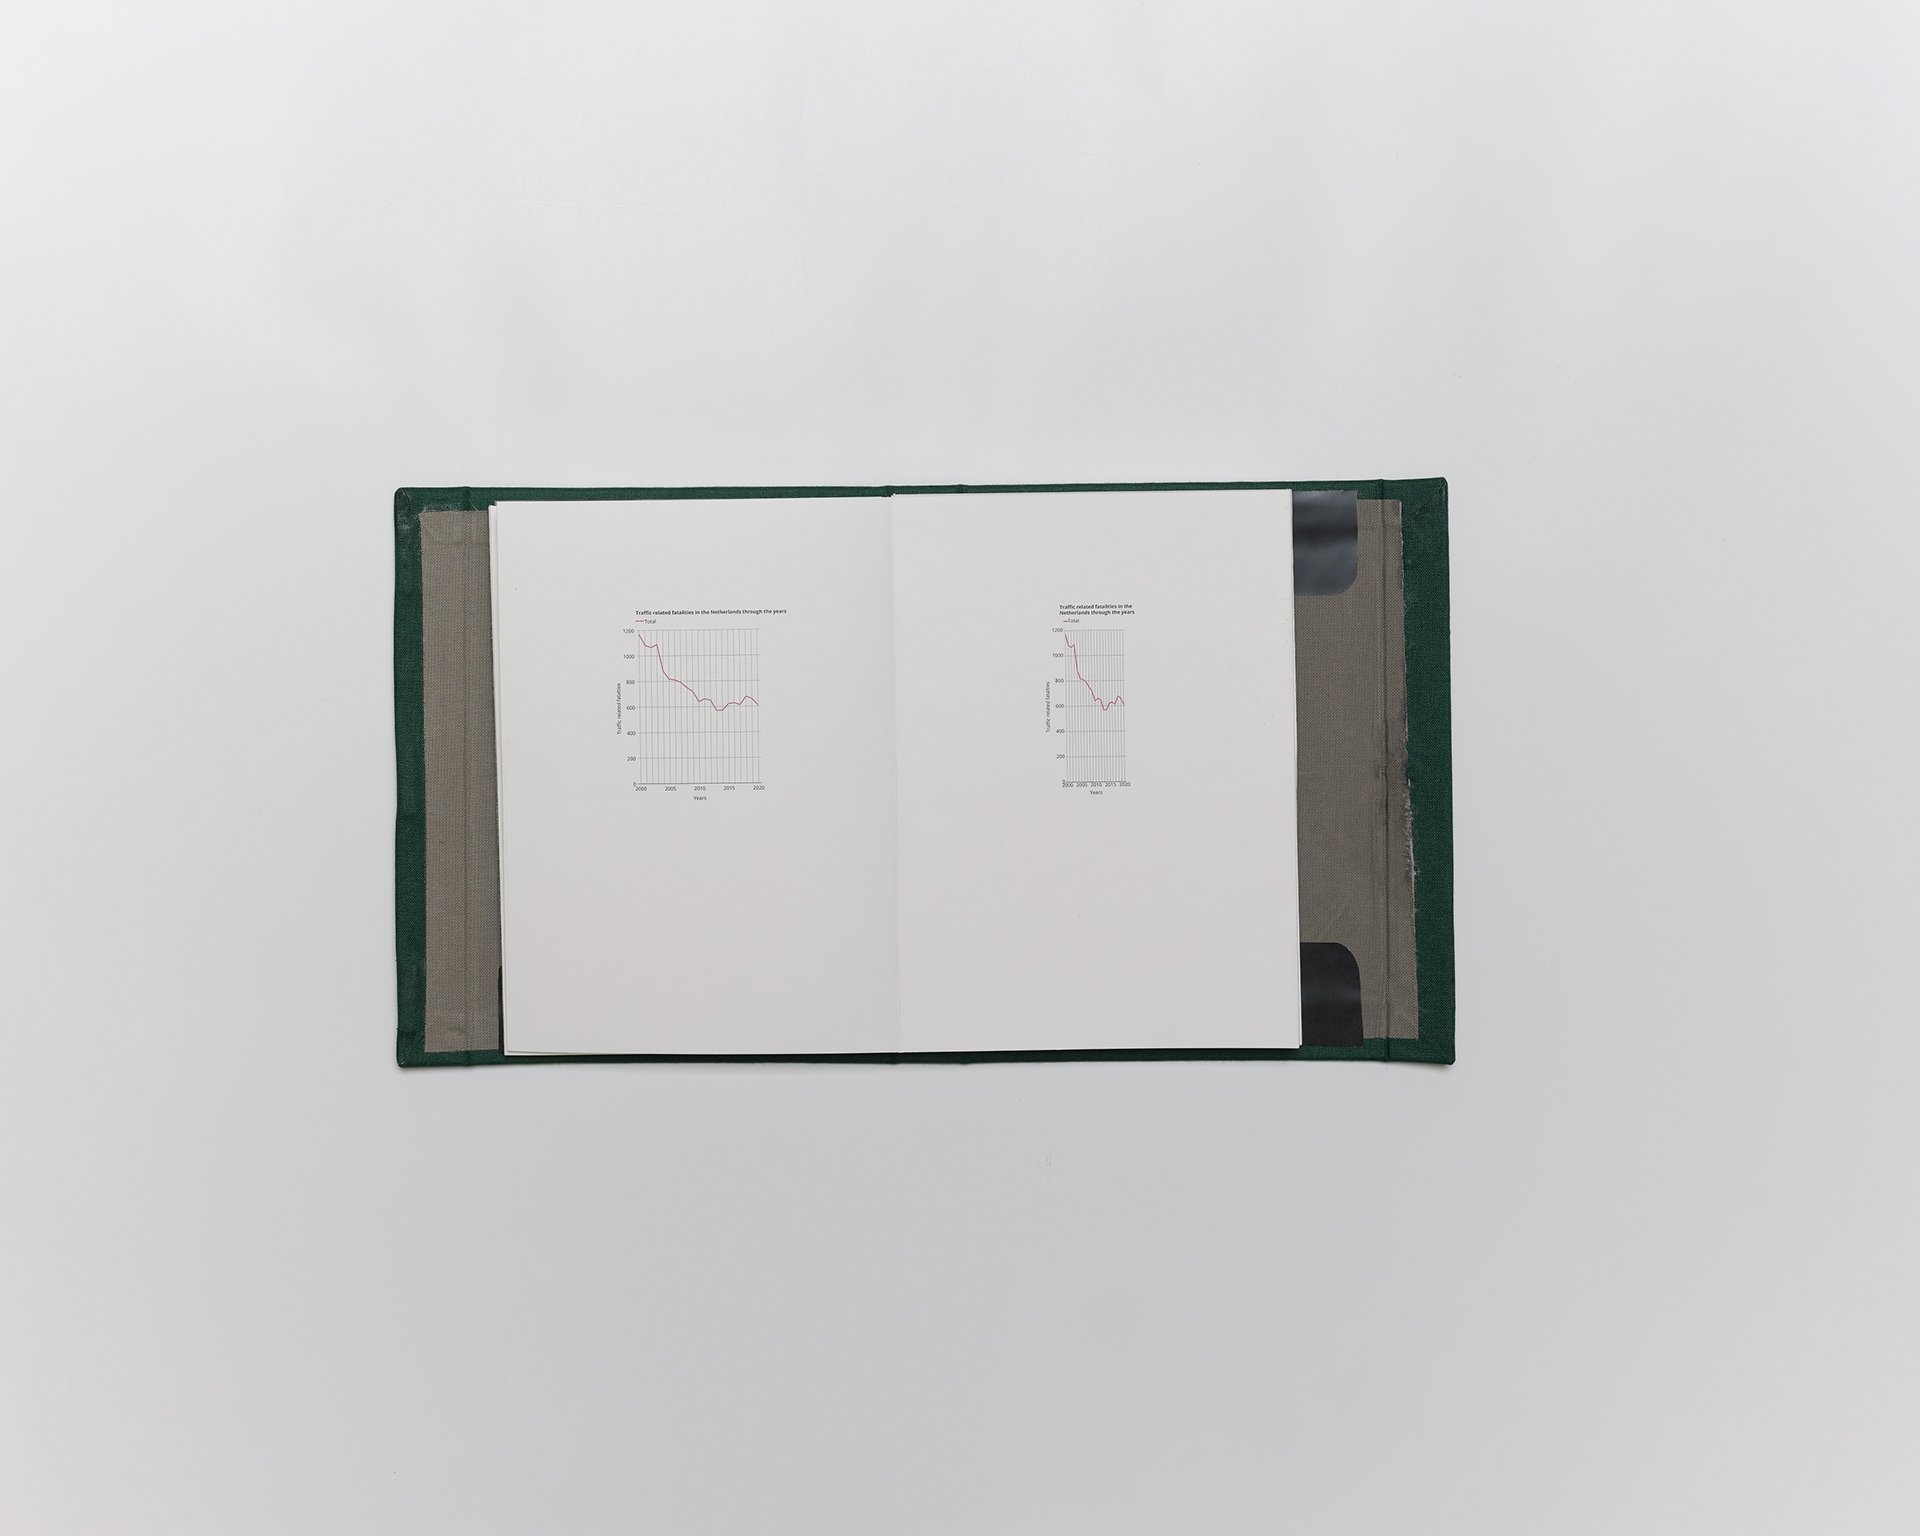
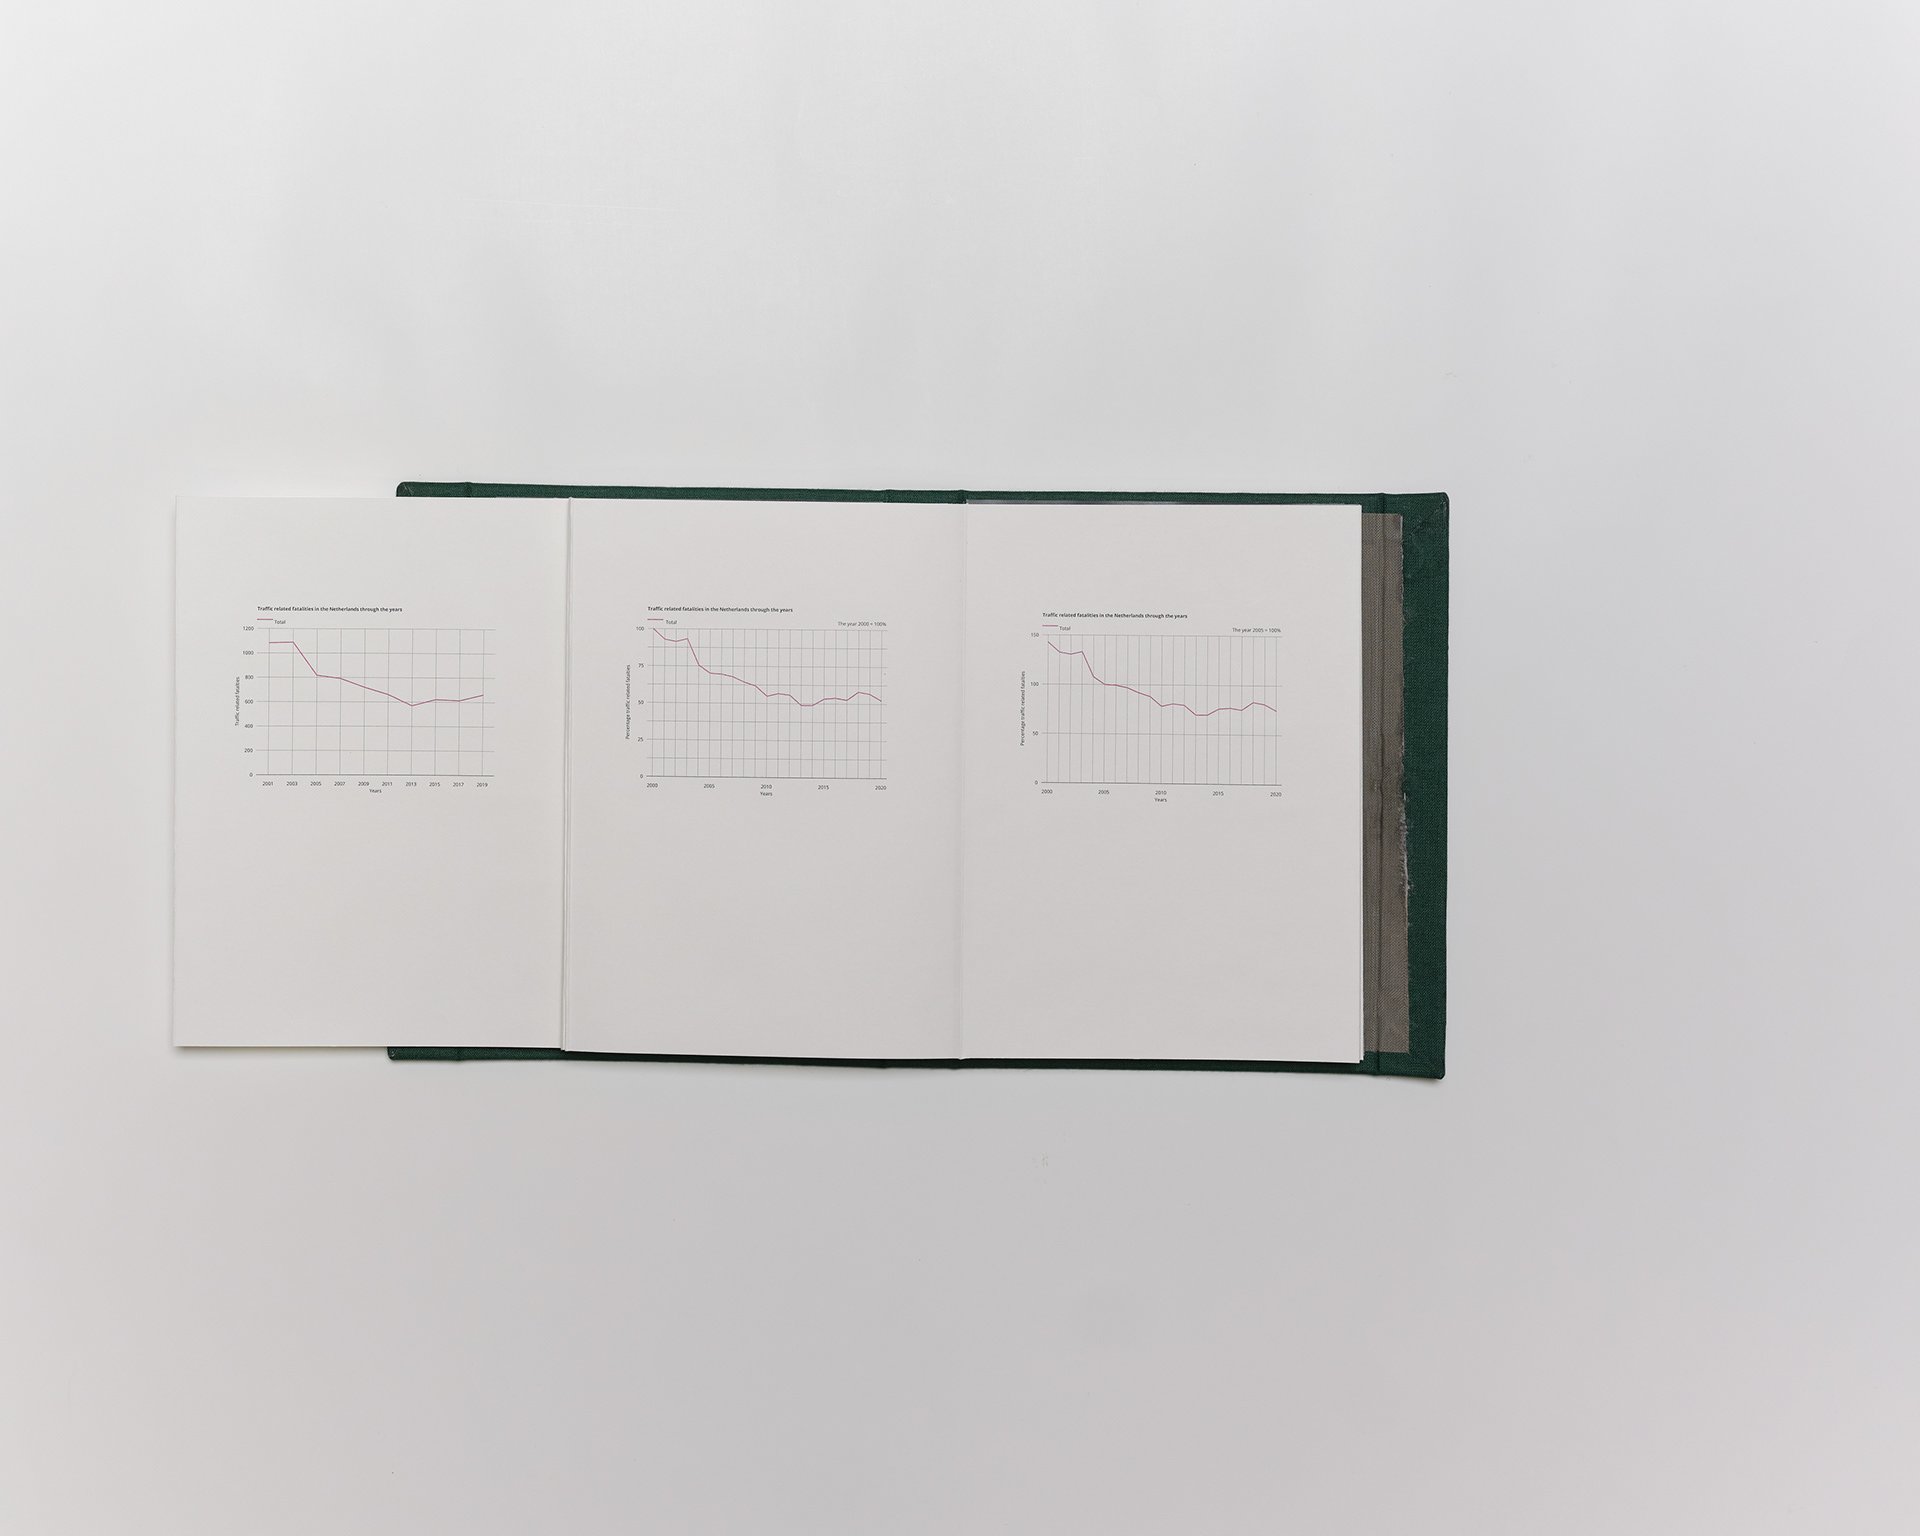
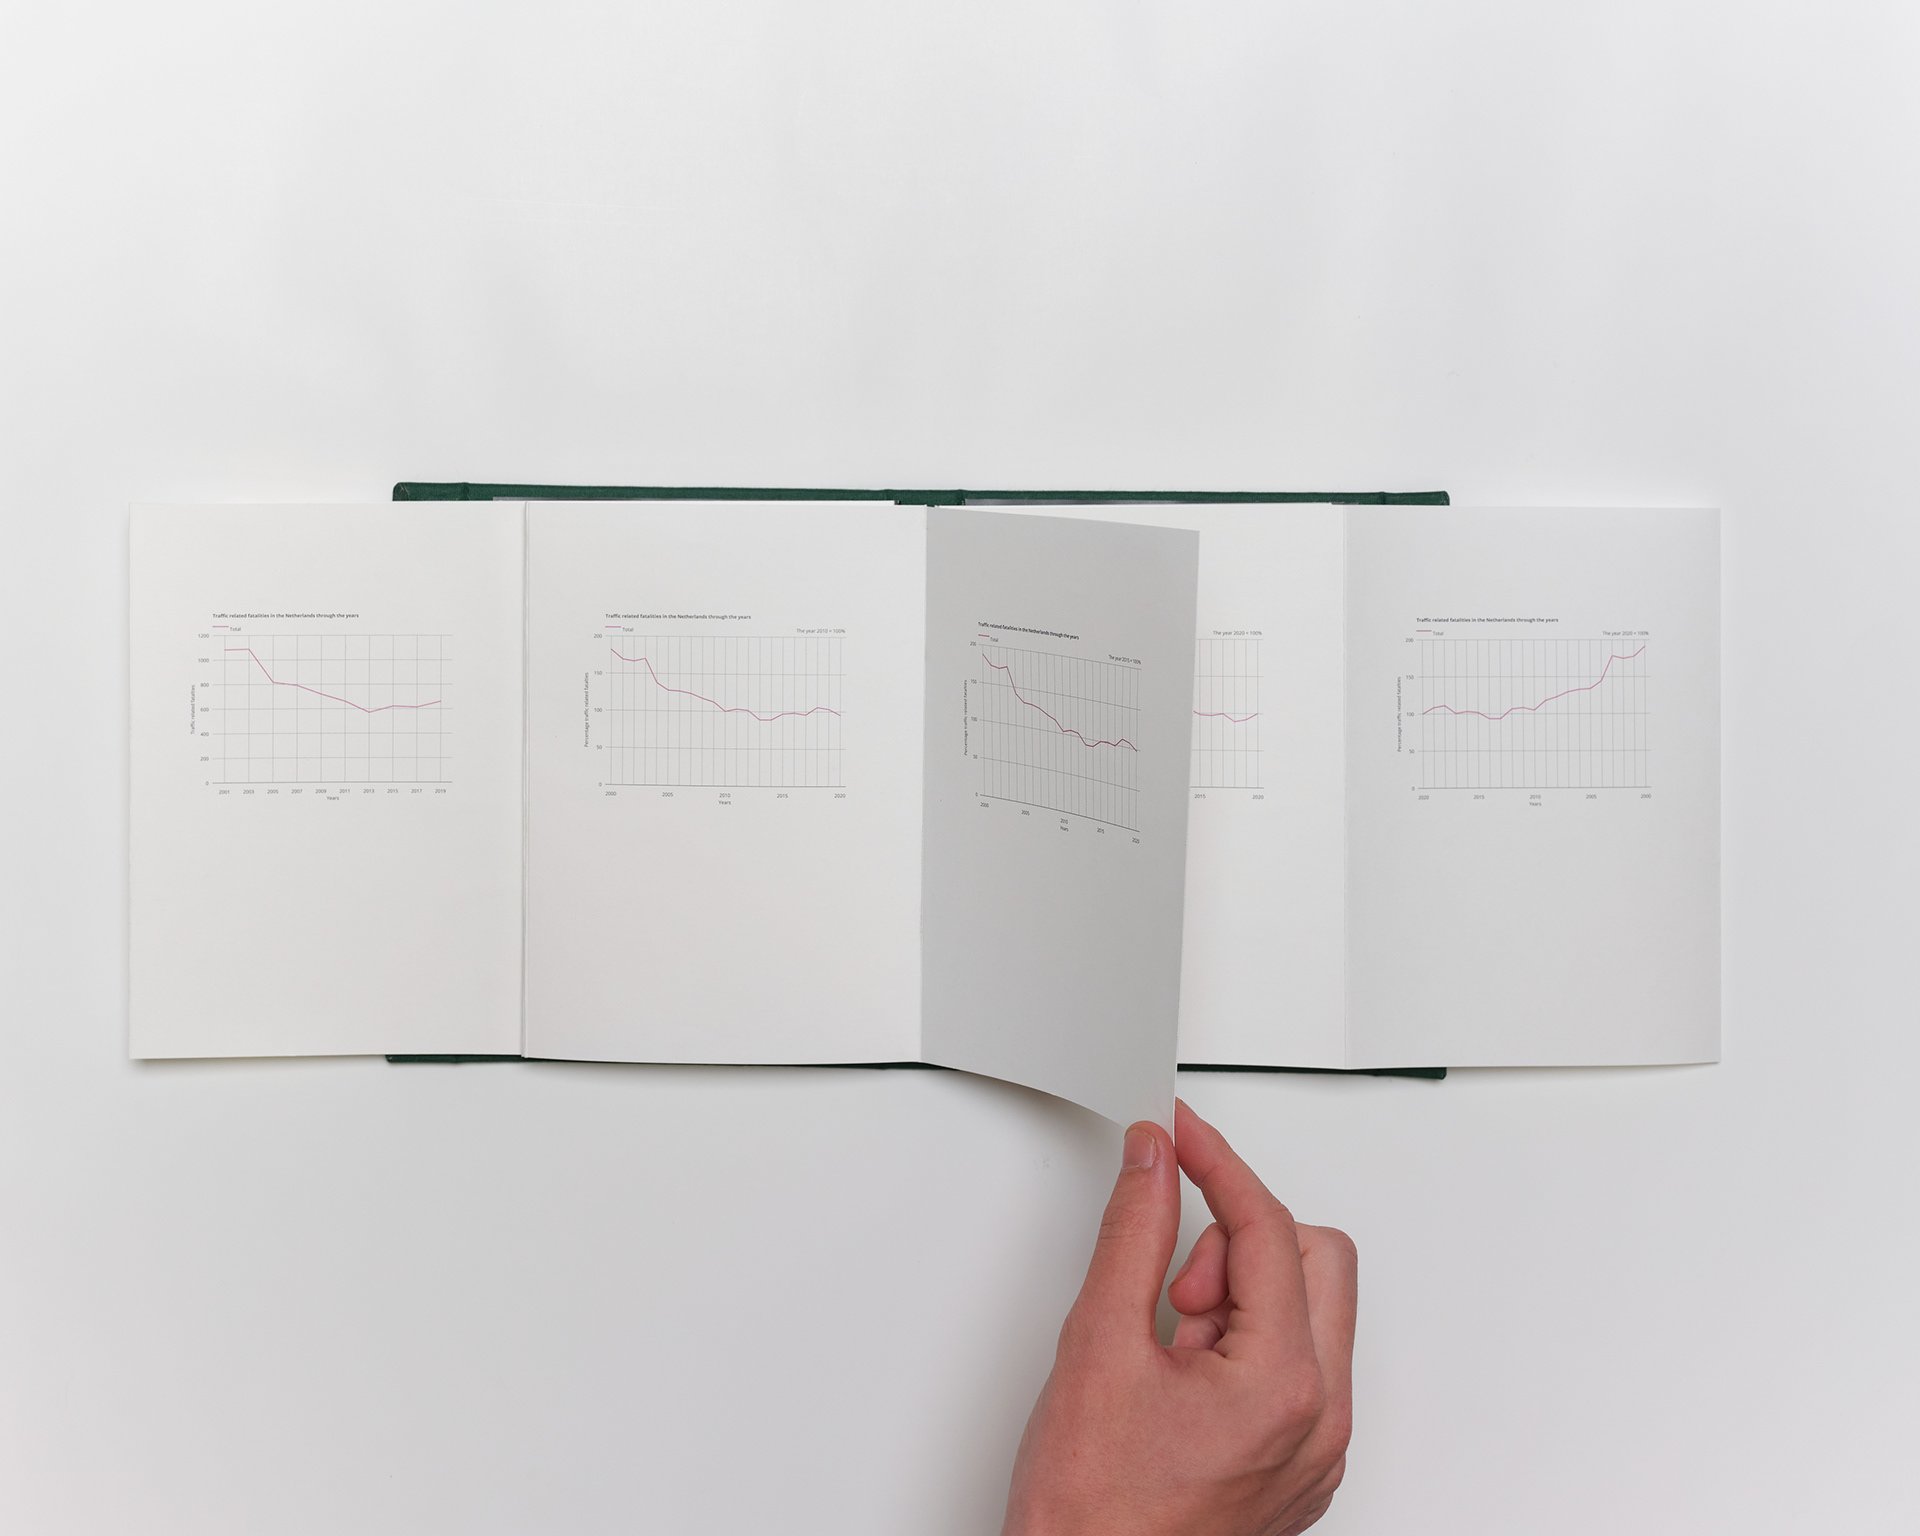
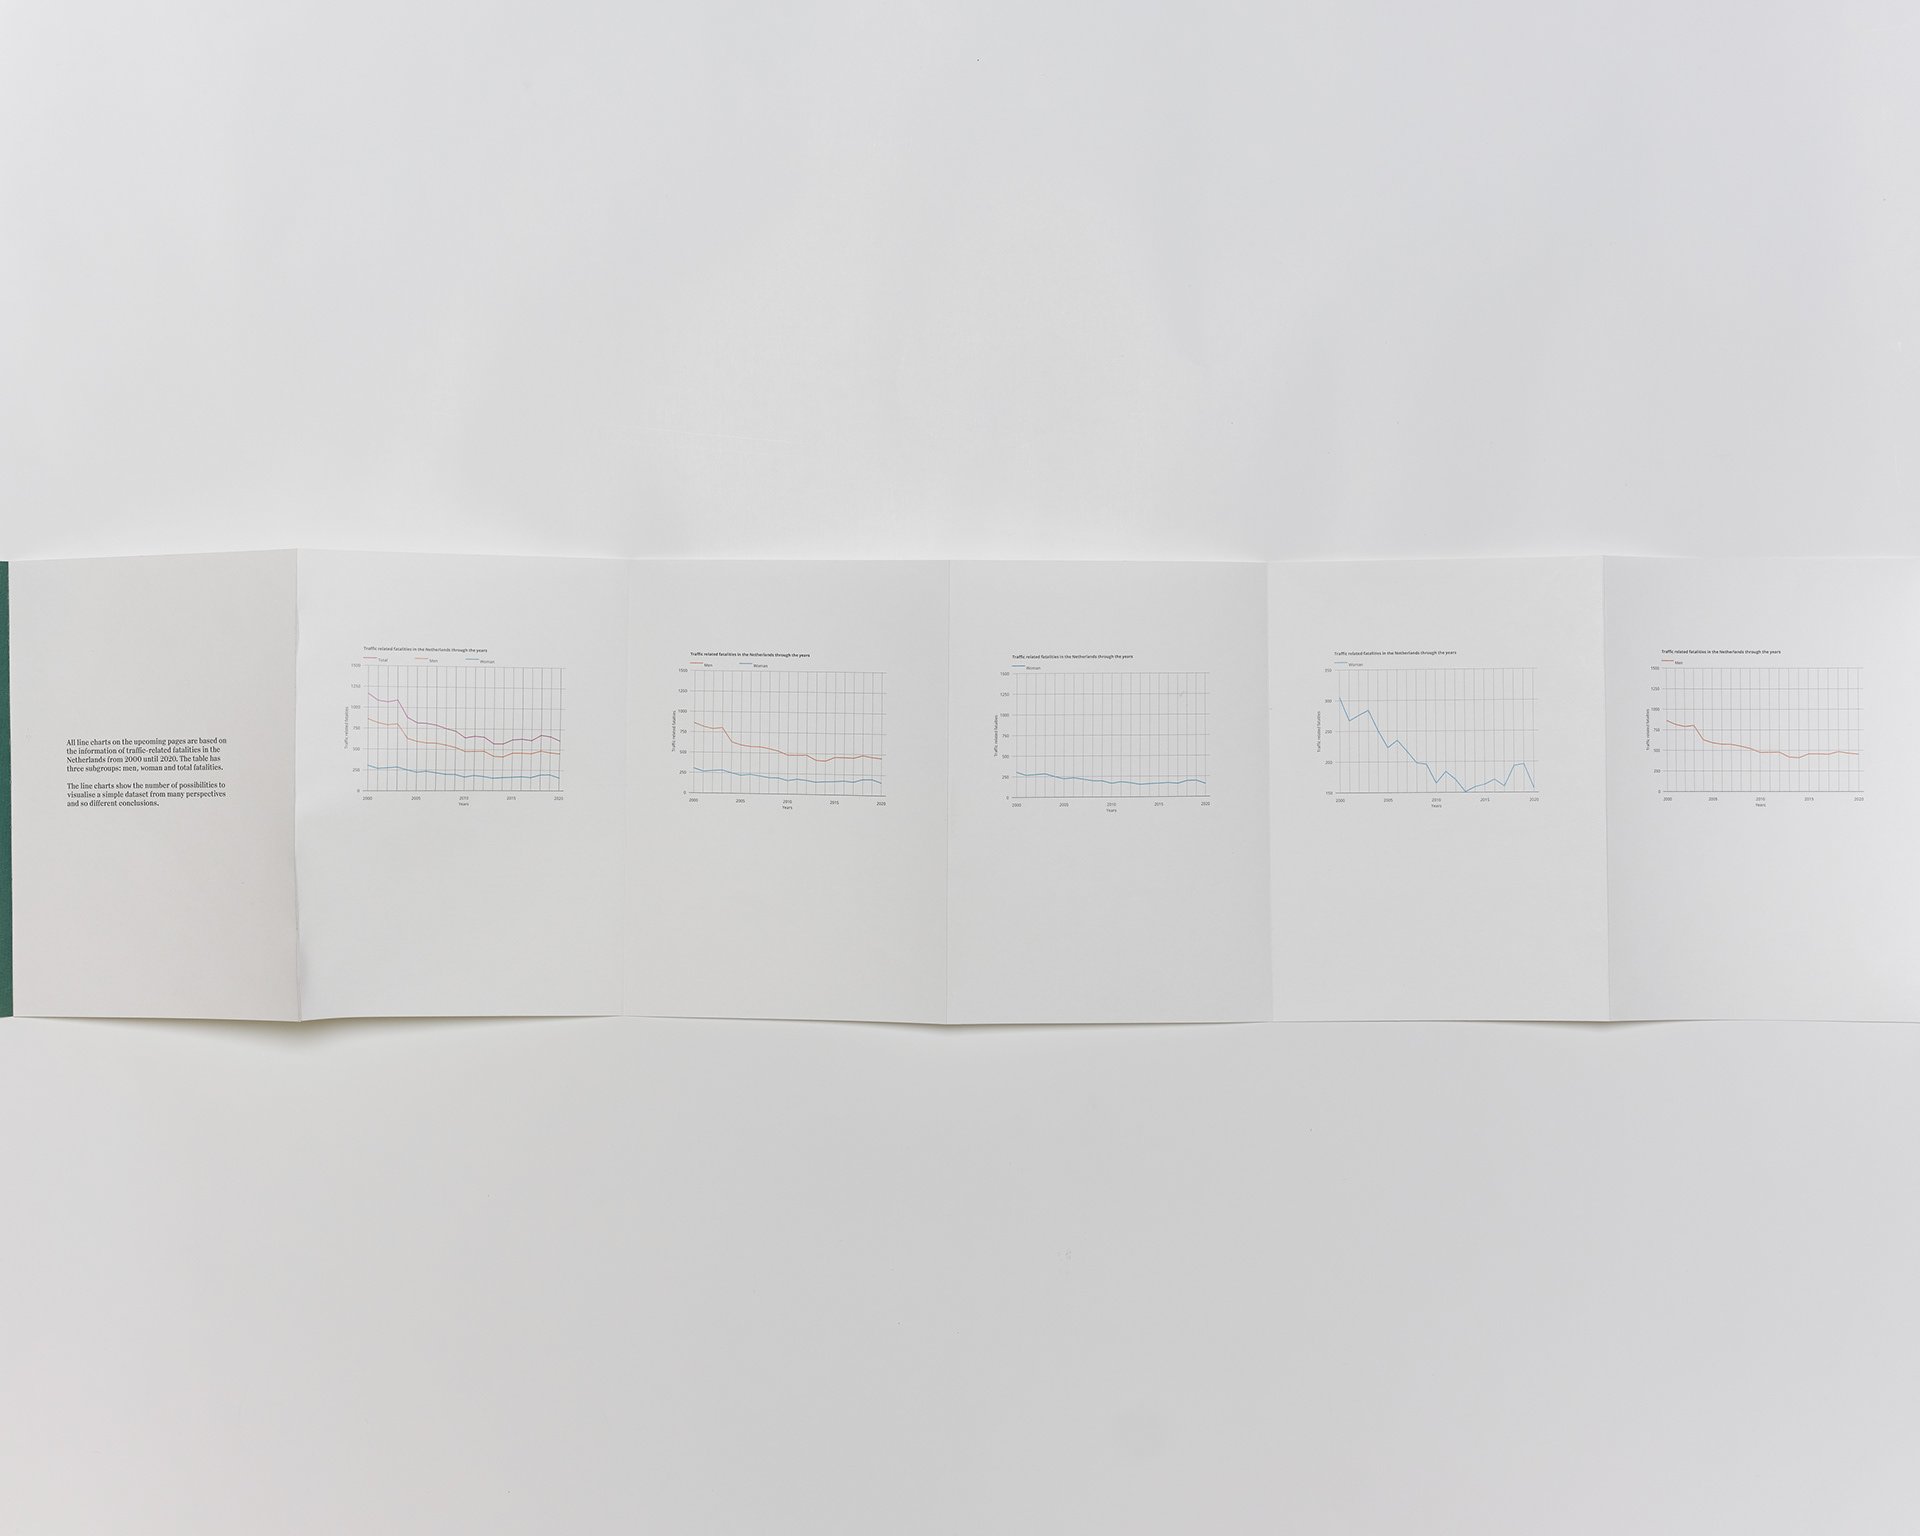
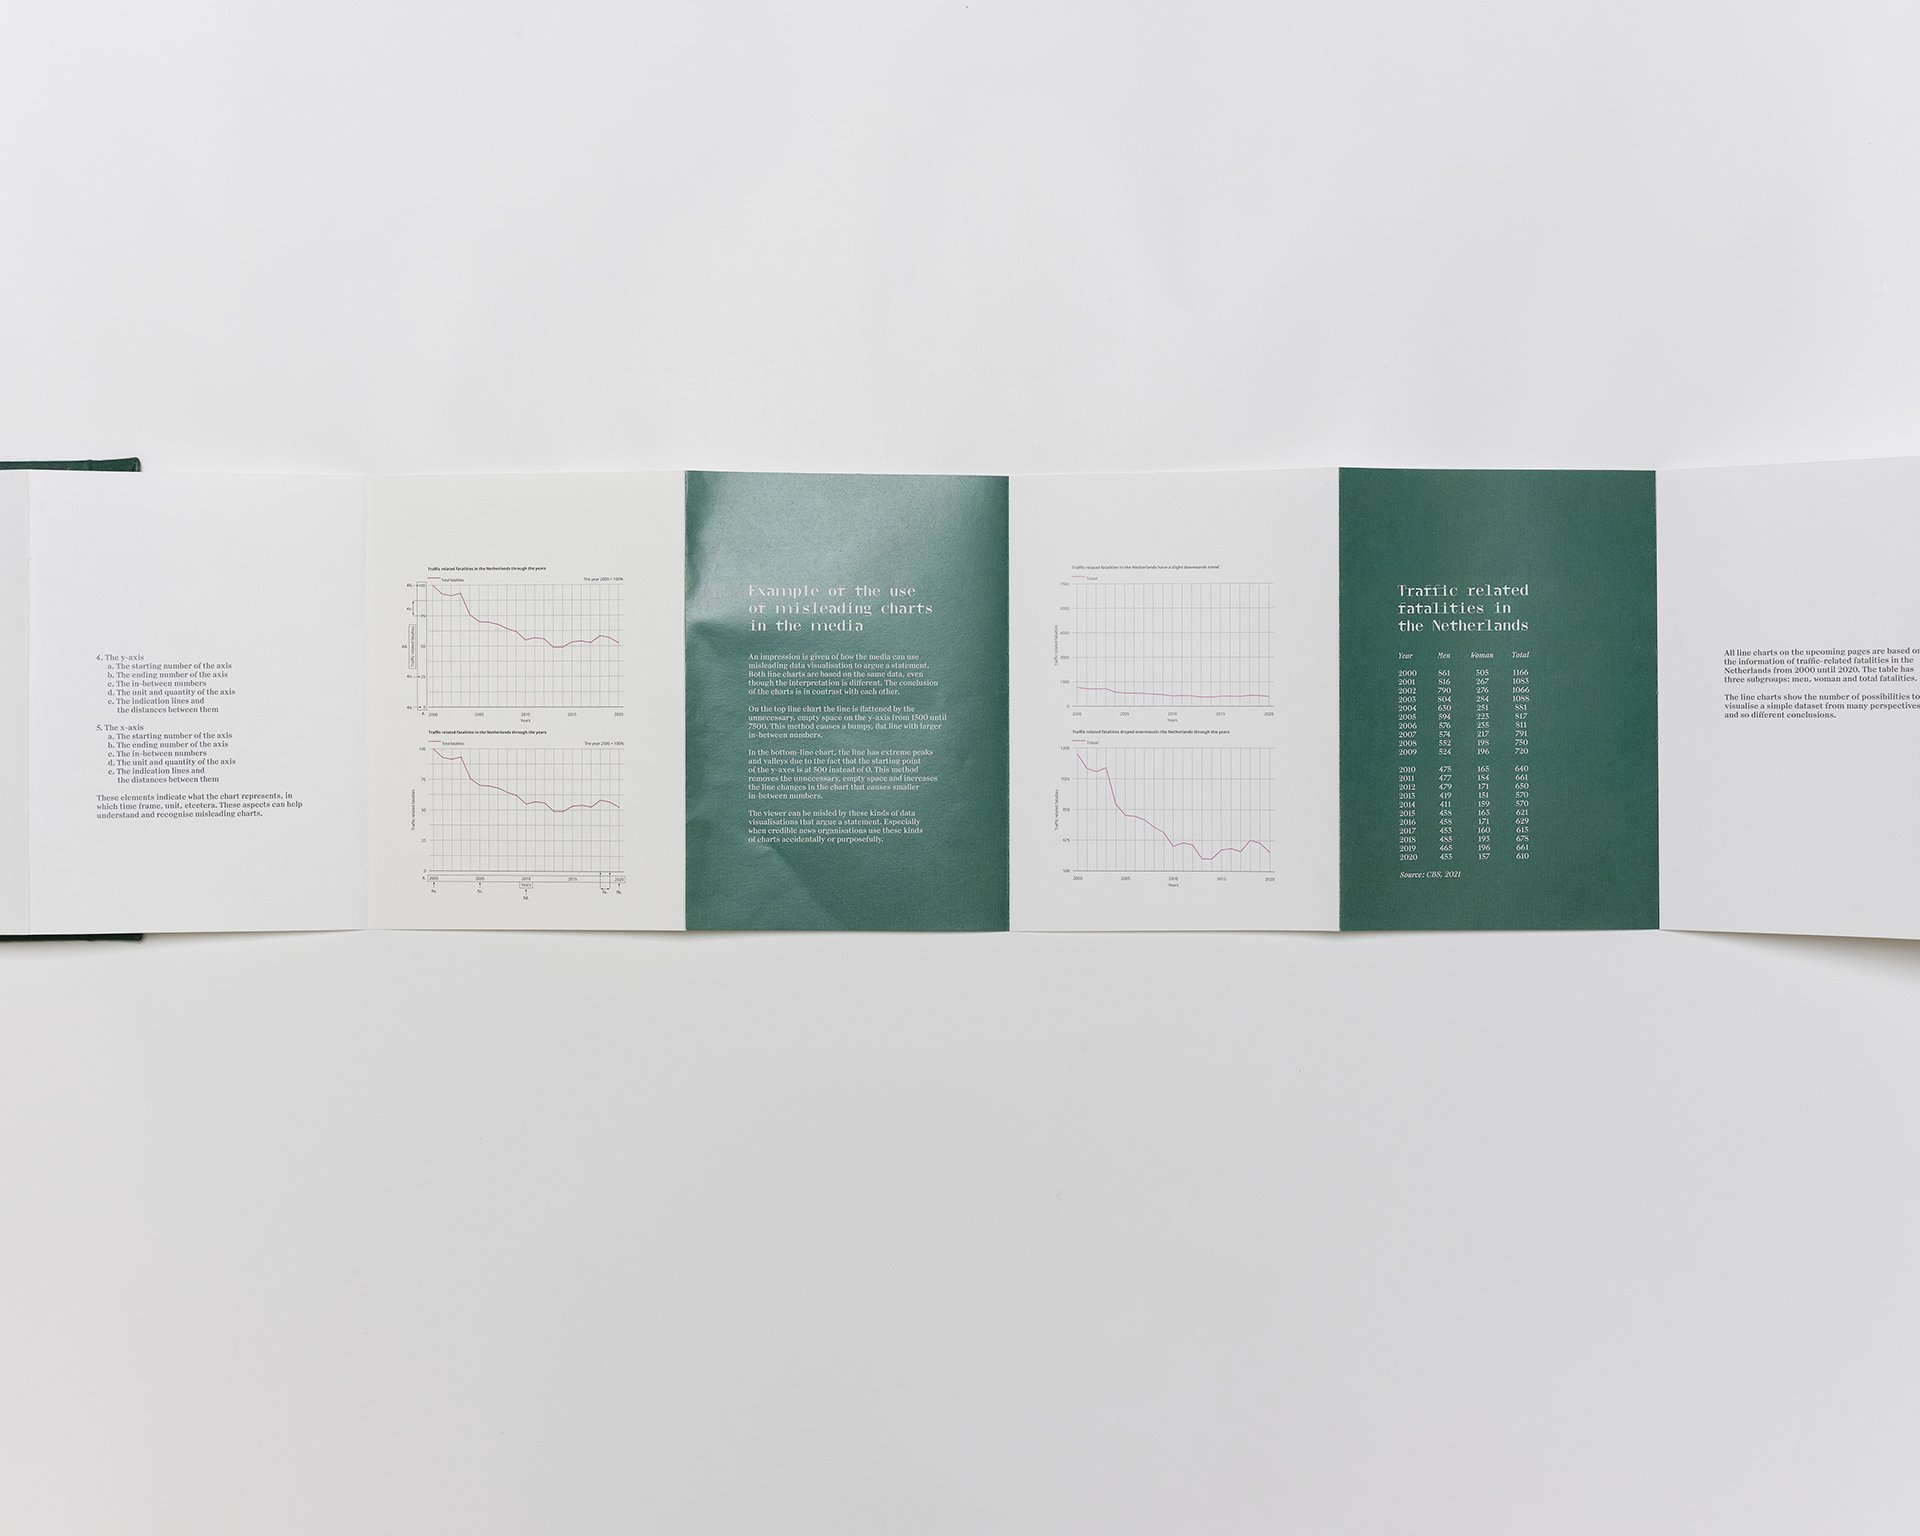
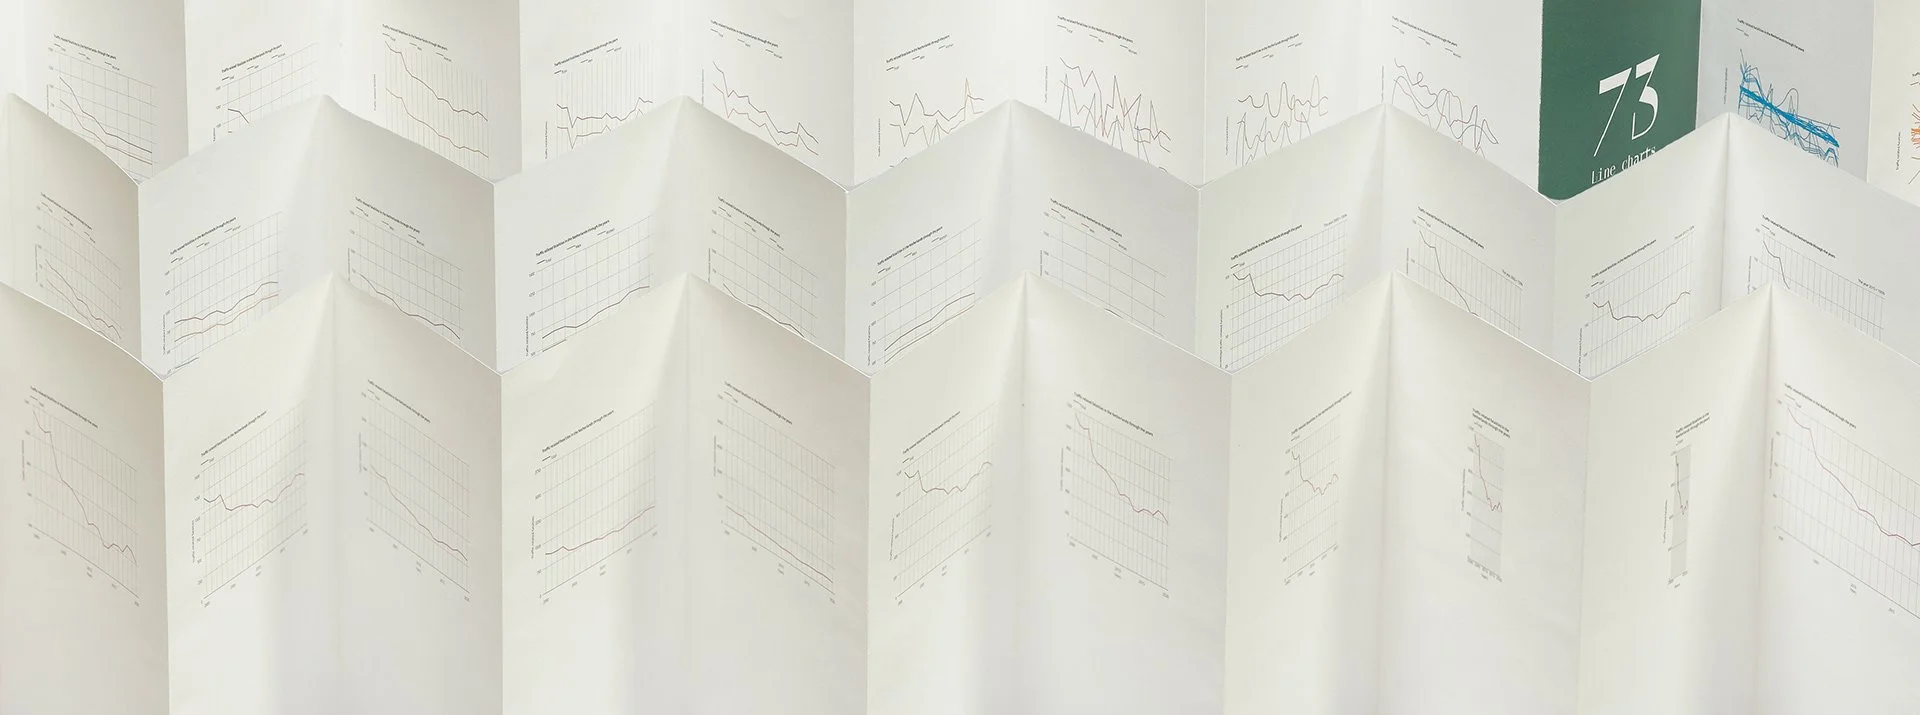
In many cases, it does not matter what kind of data is represented, it comes across as trustworthy and honest. That is why many people implicitly trust data visualisations. But even if the data is correct, the visualisation can be misleading. Within this project, I looked critically and questioned the credibility of data visualisations. Misleading data visualisation is a common problem that can pass unnoticed. The book ‘The Truth isn’t Telling’ is a combination of an eleven-meter leporrelo, book and an exhibition piece that makes the reader aware of misleading data visualisation and helps them to recognise it. Alongside this, the maker becomes aware of the preciseness and accuracy of creating data visualisations.
The book is a part of a series of books, this book is focused on the line charts. The other books in the series could be focused on different data visualisations such as pie charts or bar charts. In combination with workshops, the project gets more personally engaged and causes more clarification and personal awareness. As a result, false statements, misleading,and manipulation within data visualisation get illuminated.
